Using the JTAG Chain Debugger
To check the current Pin Mapping / Test Reset Sequence / TCK Frequency, click Check Chain. This will first do the following:
- Sets the pin mapping on the XJLink.
- Runs the Test Reset Sequence (if specified).
- Clocks data around the JTAG chain at the minimum frequency (10kHz for an XJLink2), reading the ID code from each of the devices in the chain.
At this point, if no valid data can be found, the JTAG Chain Debugger displays the following message:
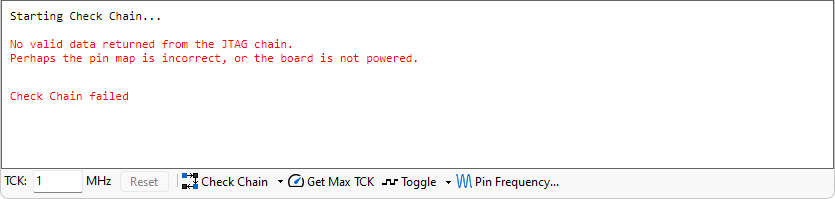
The suggested causes may be correct if you are trying to identify the correct pin mapping. Alternatively, check the data sheets for the JTAG devices on the board to see whether some kind of Test Reset Sequence is required to put them into JTAG mode. The final option is to trace signals around the JTAG chain to check for a fault on the TMS, TCK or TDO pins.
If no error was found, the JTAG Chain Debugger will continue:
- Counts the number of devices in the chain at the minimum frequency, and whether the chain is broken between devices.
If it identifies that the chain is broken between devices (either a TDI-TDO link broken, or one device not responding to JTAG mode properly) you will see a message similar to the following:
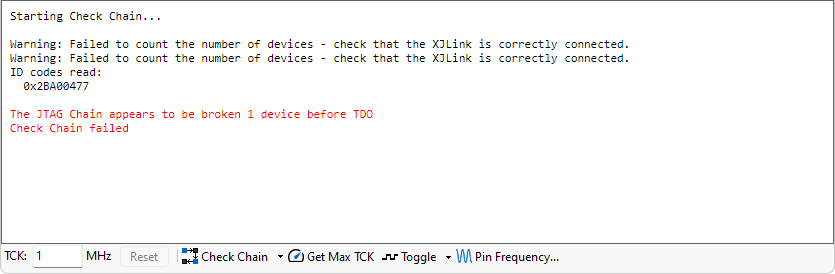
The ID codes displayed will be in order from the end of the JTAG chain (connected to TDO). If possible, check that they are correct, then check the datasheet for the next device to see if it needs a Test Reset Sequence to put it into JTAG mode. Finally, check the TDI-TDO connection indicated.
If the chain was not broken, however, the JTAG Chain Debugger continues to the following steps:
- It applies the target TCK Frequency specified.
- It counts the number of devices in the chain, and determines if the chain is broken between devices.
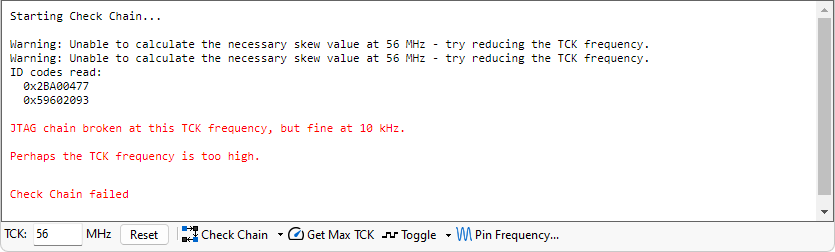
If the chain is now broken, the following message will appear:
Alternatively, if the number of devices differs from that found at the lower frequency, the following message is displayed:
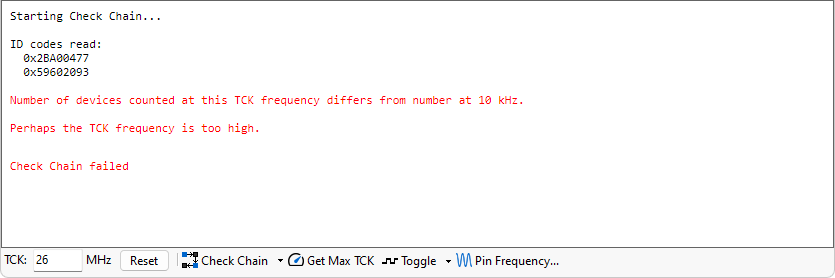
The most likely cause of these errors is, as stated, that you have tried to run the chain too fast. However, this mismatch in the number of devices found could also be caused by some instability in the board, causing different data to be returned from the JTAG chain.
Try a much slower TCK frequency, and then try finding the maximum TCK frequency automatically and check it again.
If everything works at this TCK frequency, the following message is displayed:
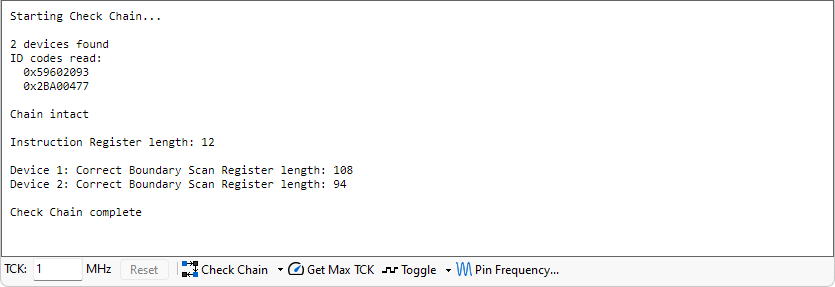
The device ID codes found are displayed, in order from the start of the chain (connected to TDI).
One further possible outcome is if the number of devices found is the same at both frequencies, but it doesn't match the number of ID codes read. The following message is displayed:
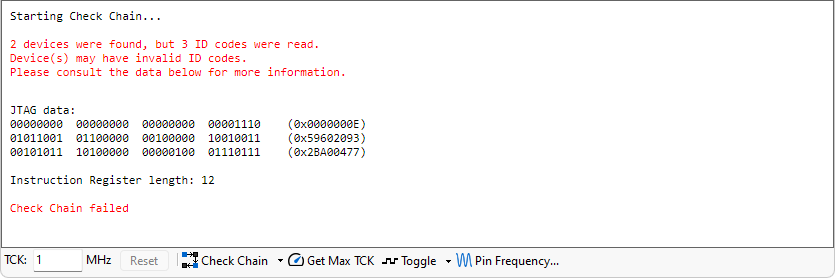
The most likely cause of this is that at least 1 device has an invalid ID code. Examples of this would be a 33 bit ID code, or an ID code whose least significant bit is a 0 instead of a 1. The number of devices counted is the trustworthy source of information. The binary and hex data shown in the output is in order from TDI to TDO. This can be used to check that the ID codes read are correct.
XJTAG v4.3.0