Summary Statistics
This tab allows the user to select the whole circuit or any sub-item in it to show the calculated test coverage for that item. The list of circuit elements can be expanded as required to drill down to individual pins.
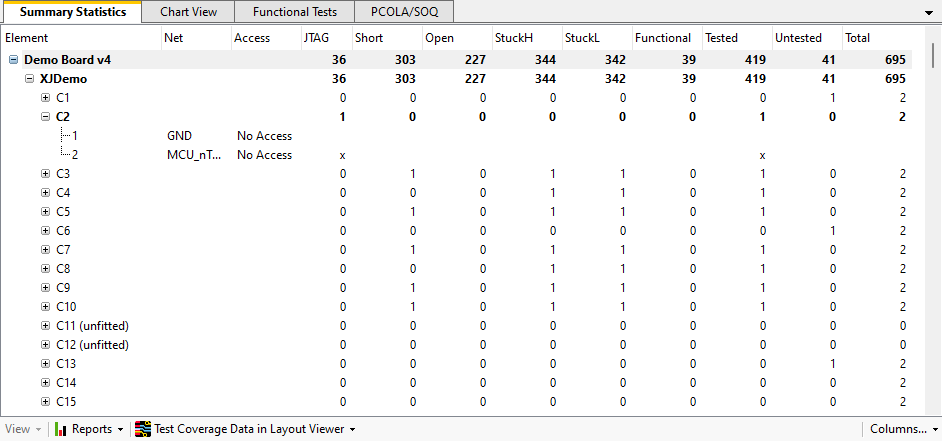
The selected item in the Summary Statistics tab is also the item which is displayed in the Chart View tab.
Viewing test coverage
The columns that XJDeveloper shows in the Summary statistics panel can be configured by clicking the Columns... dropdown menu at the bottom of the panel and selecting or deselecting columns to suit your needs and the width of your screen.
You can sort the statistics by any of the columns shown. Click a column header to sort by that column, and then again to toggle the sort order of the entries between ascending and descending.
The circuit elements which are shown in the Summary statistics panel can also be filtered by using the Options panel. The selected filters can affect the statistics displayed.
When a device, net, or pin is selected, you can use the View dropdown menu to open the Explorer tool, the Layout Viewer window or the Schematic Viewer to get more information about the currently selected item.
Creating reports
Use the  Reports dropdown menu to generate reports on the test coverage results which can be printed or exported to another application. For more details see Test Coverage Reports.
Test Coverage in Layout Viewer
Use the  Layout Viewer dropdown menu to display the test coverage analysis results in graphical format in Layout Viewer. This is particularly useful for highlighting areas of the board where test coverage could be improved.
XJTAG v4.3.0