XJEase Waveform View Window
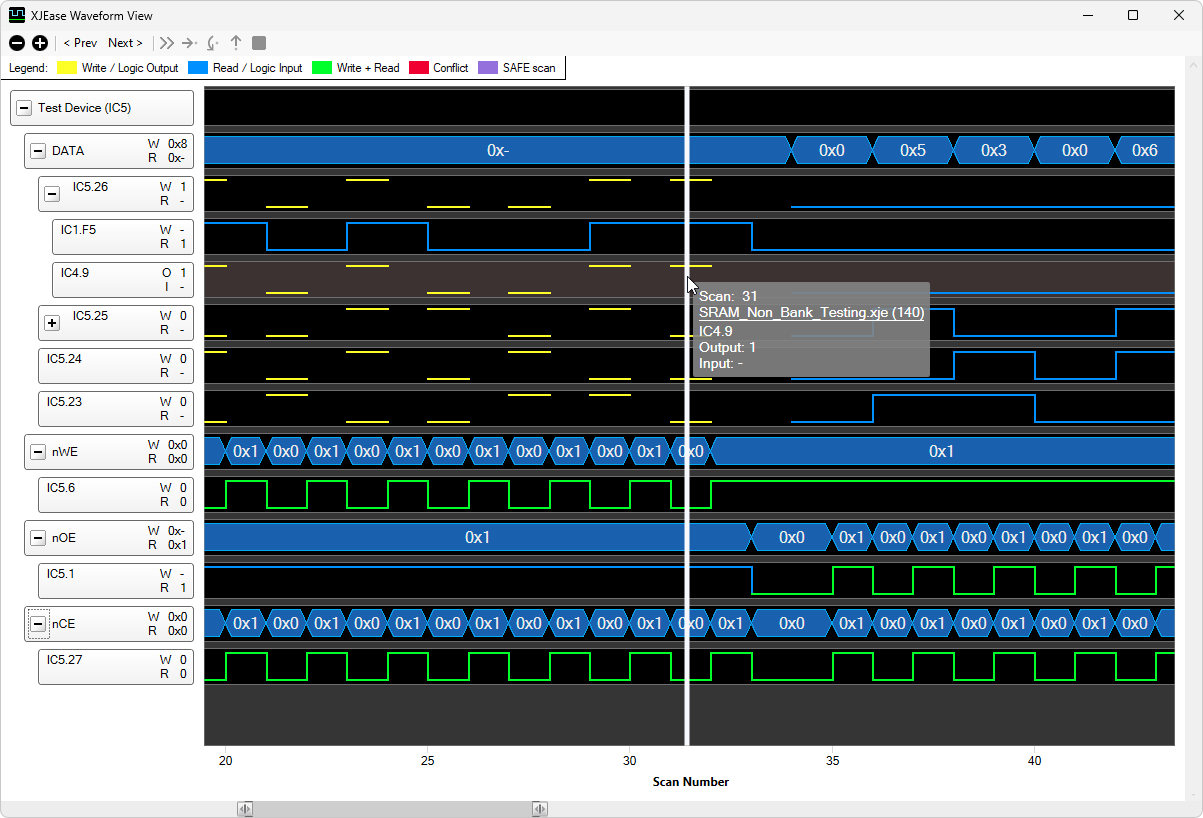
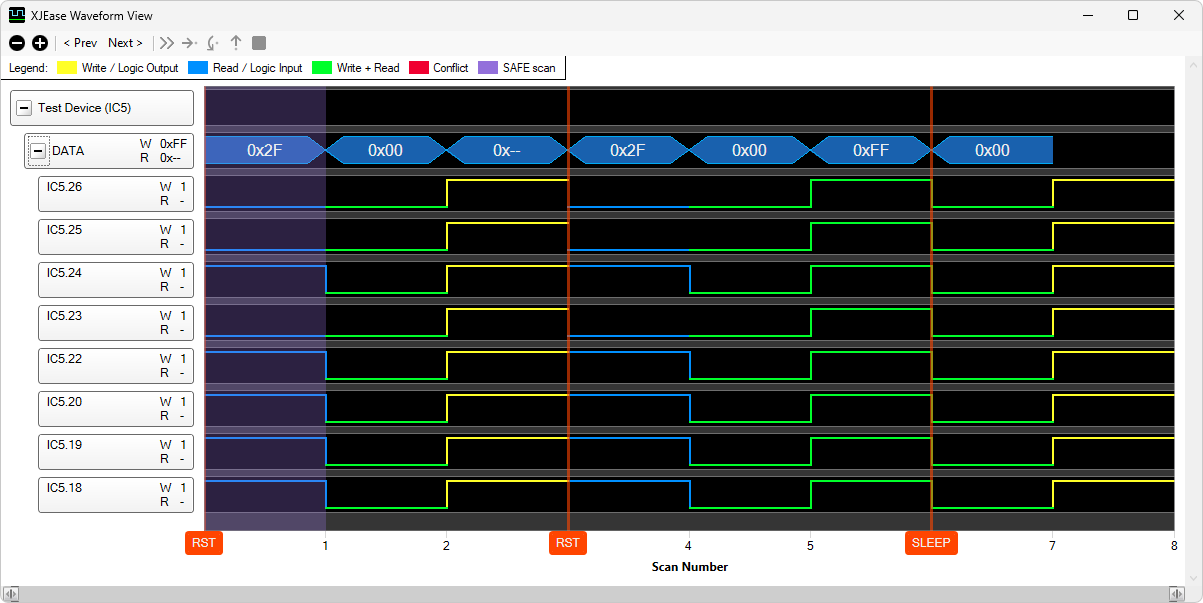
The XJEase Waveform View is designed to look like a logic analyser, however instead of the bottom axis representing time, it shows the number of scans since the start of the capture.
Waveform data
Captured data is displayed as waveforms. The pins which were chosen when selecting the test to capture are displayed and grouped into devices and busses on the left. Busses can be expanded to show their pins or collapsed to show just values. Device pins can be expanded to show each of the pins driving or reading it if there are multiple and they were selected for capture.
Moving the mouse across a waveform will show a vertical bar at the current scan number and the labels on the left will display the values captured for that scan. You can mark a scan by double-clicking on the vertical bar, which will leave a vertical red line in the waveform view. You can unmark the scan by right-clicking on the red line.
N.B. The data shown for a pin in a bus is actually the data captured by an 'active' (JTAG, logic or 3rd-party external hardware) pin on the same net. In the event of an open-circuit fault the actual value of the pin on a test device may differ from that recorded - this is to be expected and is indicative of a fault which can be detected by XJEase code (i.e. an unexpected value is read).
When capturing JTAG data, each time the JTAG chain is scanned, the Write values are set for the current scan but the values read at this time are those resulting from the previous scan. This can be observed when single-stepping through code because the current (right-most) scan generally only shows Write values and the Read values are filled in when the next scan is sent.
Legend
The legend at the top of the window shows the colours used to show whether pins are being driven or read.
- Write / Logic Output - A pin on the bus is being actively driven by JTAG, a logic device or supported 3rd party external hardware.
- Read / Logic Input - The pin is being read through a pin on a JTAG device, a logic block on the net or supported 3rd party external hardware.
- Write + Read - The pin is being simultaneously written to and read from with the same value.
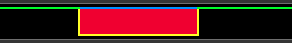
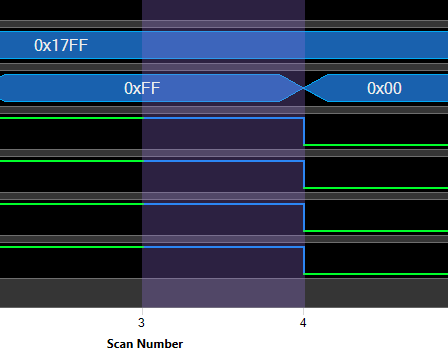
- Conflict - When read and write values differ, a conflict is highlighted by shading the area between the conflicting traces in the waveform.
- SAFE scan - The entire scan will be highlighted when it is part of a SAFE scan.
Waveform tooltip
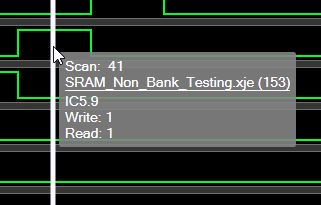
Hovering the mouse over a waveform will display a tooltip containing further information. It will show the scan number, the file location of the source of the scan, SAFE (if it is a SAFE scan), the pin or bus name, the write value and the read value.
Scan events
Some events that occur between scans will be labelled:
- RST - A test reset has occurred. This will either be a TMS reset or a Test Reset Sequence defined on the Pin Mapping screen.
- XJModule - Code has been run inside an XJEase module file.
- CONNTEST - The CONNTEST function has been run.
- SLEEP - A SLEEP has occurred.
- NANO_SLEEP - A NANO_SLEEP has occurred.
- SVF - An SVF file has been run.
- STAPL - A STAPL file has been run.
When more than one event occurs between two consecutive scans they will be appended to the same label, e.g. RST + SLEEP, but are not shown in any particular order. If the same event occurs multiple times between two scans it will only be shown once.
Toolbar items
The toolbar at the top of the window contains:
 and
and  - Zoom into or out of the waveform. The zoom level can also be set by dragging the ends of the horizontal scrollbar.
- < Prev and Next > - Scroll the previous or next waveform transition into view.
- Debugging controls - Control code execution during a test directly from the XJEase Waveform View. The debugging controls will be disabled if there are no breakpoints set in the project.
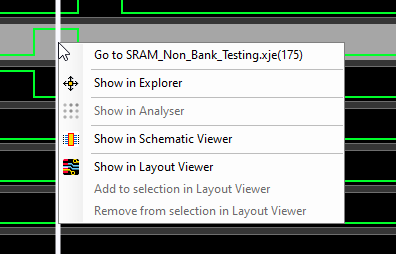
Waveform context menu
Right-clicking on a waveform will show a context menu that will allow you to view the pin in Explorer, Schematic Viewer or Layout Viewer. Clicking Show in Analyser will show the pin on the Analyser screen if it is a JTAG pin. When the scan is the result of a SET statement or explicit SAFE call, you can go to the source of the scan in the code editor.
Keyboard shortcuts and mouse actions
- Ctrl + Mouse Scroll - Zoom in/out on scans
- Shift + Mouse Scroll - Pan left/right through scans
- Ctrl + Left Arrow - Skip to the previous transition
- Ctrl + Right - Skip to the next transition
- Ctrl + Mouse Left-click - Navigate to the source of a scan in the code editor
- F8 - Continue running if paused while debugging
- F10 - Step over if paused while debugging
- F11 - Step in if paused while debugging
- Shift + F11 - Step out if paused while debugging
XJTAG v4.3.0