Breakpoints
Breakpoints can be set on the Test Device Files and Circuit Code Files screens by:
- Pressing F9
- Clicking
 Toggle Breakpoint from the Debug Menu
 - Clicking in the margin next to a line number
All breakpoints are listed in the Breakpoints pane.
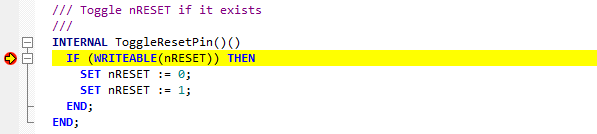
When a breakpoint is reached, code execution will be paused and the line that is about to be executed will be shown and highlighted on the relevant XJEase code editor screen. The corresponding call stack frame will also be shown.
Execution can be controlled using the options on the toolbars or the Debug menu on the XJEase code editor screens:
 Continue - Execution will continue until another breakpoint is reached or execution is completed.
 Step Into - The current line shown in the XJEase editor will be executed and the debugger will pause on the next line. If the current line is a function call, then execution will stop at the first line inside this function.
 Step Over - The current line shown in the XJEase editor will be executed and the debugger will pause on the next line of the current function.
 Step Out - The rest of the current XJEase function will be executed and the debugger will then pause.
 Stop - Execution will be stopped.
These controls are also available on the Run Tests screen while code execution is paused after hitting a breakpoint.
XJTAG v4.3.0