Understanding reported errors
What errors does Connection Test find?
XJTAG's connection test will attempt to check your circuit for assembly issues. If the test completes it will either pass or give a list of errors that it found. If the test does not complete there will be an error message, usually because the JTAG chain has broken during the test. The Debug Connection Test screen in XJDeveloper and XJInvestigator is useful for debugging broken chain messages.
If connection test completes but the result is a failure, the list of errors will give information about what was found. More details about the types of error connection test can find are in the XJTAG User Guide's chapter about connection test errors.
Increasing output verbosity
In XJDeveloper, XJInvestigator or XJRunner
The first step in tracking down a fault reported by the Connection Test is to make sure the test is outputting enough data. If you are using the standard CONNTEST global function in your test list, then check that the Default Error Detail Level on the Connection Test Settings tab on the XJRunner Setup screen is set to All.
Alternatively, the level can be temporarily changed by clicking Options below the list of tests and changing the slider on the Connection Test tab.
From code or in command line tools
If the Connection Test is being run by explicitly calling the CONNTEST function from XJEase code, then pass 0 (or the constant CONNTEST_DEBUG_ALL) as the first argument to print the full results to the screen:
CONNTEST(CONNTEST_DEBUG_ALL)(nErrors);
Reading the Connection Test output
When running from XJDeveloper, XJRunner or XJInvestigator, any errors in the Connection Test will be displayed in a manner looking like this:
N.B. The Net Detail and Error Detail sections in the panel below can be expanded by clicking on them.


Error on net COMMS_INT-COMMS_INTa: Open circuit error between the JTAG pins.
Net Detail
Net COMMS_INT-COMMS_INTa contains:
- Linked net XJDemo.COMMS_INT
- FCJ1.3 (PASSIVE)
- TP76.1 (UNFITTED)
- U2.B4(PTC18) (JTAG)
- Linked net XJDemo.COMMS_INTa
- FCJ1.4 (PASSIVE)
- U1.64(IO64) (JTAG)
Error Detail
| U2.B4 | U1.64 | |||
|---|---|---|---|---|
| W | R | W | R | |
| 0 | - | 0 | 0 | 0 |
| 1 | - | 0 | 1 | 1 |
| 2 | - | 0 | 0 | 0 |
| 3 | - | 0 | 1 | 1 |
| 4 | - | 0 | 0 | 0 |
| 5 | - | 0 | 1 | 1 |
| 6 | - | 0 | 0 | 0 |
| 7 | - | 0 | 1 | 1 |
| 8 | - | 0 | 0 | 0 |
| 9 | - | 0 | 1 | 1 |
| 10 | - | 0 | 0 | 0 |
| 11 | - | 0 | 1 | 1 |
| 12 | - | 0 | - | 1 |
| 13 | - | 0 | - | 1 |
| 14 | - | 0 | - | 1 |
| 15 | - | 0 | - | 1 |
| 16 | - | 0 | - | 1 |
| 17 | - | 0 | - | 1 |
| 18 | - | 0 | - | 1 |
| 19 | - | 0 | - | 1 |
| 20 | - | 0 | - | 1 |
| 21 | - | 0 | - | 1 |
| 22 | - | 0 | - | 1 |
| 23 | - | 0 | - | 1 |
| 24 | - | 0 | - | 1 |
| 25 | - | 0 | - | 1 |
| 26 | - | 0 | - | 1 |
| 27 | - | 0 | - | 1 |
| 28 | - | 0 | 0 | 0 |
| 29 | - | 0 | 1 | 1 |
| 30 | - | 0 | 0 | 0 |
| 31 | - | 0 | 1 | 1 |
| 32 | - | 0 | 0 | 0 |
| 33 | - | 0 | 1 | 1 |
| 34 | - | 0 | 0 | 0 |
| 35 | - | 0 | 1 | 1 |
| 36 | - | 0 | - | 1 |
| 37 | - | 0 | - | 1 |
| 38 | - | 0 | - | 1 |
| 39 | - | 0 | - | 1 |
| 40 | 0 | 0 | - | 1 |
| 41 | 1 | 1 | - | 1 |
| 42 | 0 | 0 | - | 1 |
| 43 | 1 | 1 | - | 1 |
| 44 | 0 | 0 | - | 1 |
| 45 | 1 | 1 | - | 1 |
| 46 | 0 | 0 | - | 1 |
| 47 | 1 | 1 | - | 1 |
The error has a title in red which tells you the name(s) of the affected nets and describes the type of error.
The Net Detail section shows the structure of the connected nets and all the pins that are connected to them.
The pairs of columns in the Error Detail section give write (W) and read (R) values for each pin on the open net. The numbers on the left are the step numbers of the Connection Test.
The possible values in the W and R columns are:
- 1 - the net was written (W column) or read (R column) as a High logic level.
- 0 - the net was written (W) or read (R) as a Low logic level.
- – - no data was recorded for this entry.
- # - both high AND low values were recorded for this entry (e.g. a net with two pins, one read high at the same time as the other read low).
If there are logic devices attached to the net with the error, Connection Test will output the values it has recorded for the pins on that logic block. If the write (W) column data is in brackets, i.e. (1) or (0) instead of simply 1 or 0, it means that a logic device is assumed to be driving this value. If the value read is different to the value assumed to be written, it may be due to a fault on that net, but it might be that the fault is on one of the inputs to the logic device, or even that the wrong device has been fitted.
Marked test steps are those which are highlighted in the Connection Test output. You will see if you expand the Error Detail above that there are test steps which are highlighted in blue - these are the steps in which Connection Test has detected an abnormality. (In command line output (e.g. XJRun) these steps are marked with an asterisk (*) to the right of the test output.)
In the case above, by expanding the output Error Detail, we can see that, when U2.B4 is driven high and low (test steps 40-47), pin U1.64 just reads back 1. Likewise, pin U2.B4 does not read the values driven by pin U1.64 (test steps 28 to 35). This confirms the diagnosis of an open circuit.
Other Errors
Circuit boards can have many different errors, each with their own behaviour. XJTAG will try to diagnose the exact fault, but a board may still have an error on it that XJTAG cannot diagnose fully. If you are having problems finding a reported fault, make sure you look at the verbose debug output from the Connection Test (as above) to see the actual behaviour of the JTAG pins and nets during the Connection Test.
To help with some common problems seen on circuit boards, you can alter the Connection Test's behaviour - see the Connection Test tab in the Settings panel of the XJRunner Setup screen. One of the options you can turn on in that tab is to enable the saving of data for display in the Connection Test Output Viewer, which allows you to see all of the data from the test and analyse it yourself.
Broken Chain problems
There is a dedicated Debug Connection Test screen in both XJDeveloper and XJInvestigator, which is intended for tracking down 'broken JTAG chain' errors seen when running the Connection Test, or investigating any unexpectedly high power supply current levels seen during the test.
Finding more information
If the board being tested was setup using an ODB++ netlist then faults can be viewed in the Layout Viewer. A sample of Connection Test output showing the links to the Layout Viewer is shown below.
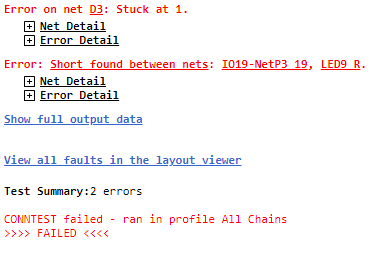
Clicking the links will clear any items shown in the Layout Viewer and display the nets. Right-clicking the link allows the nets to be added to the existing selection and, if there are PDF schematic files assigned to your board, the nets can be viewed in the Schematic Viewer. If you are running XJDeveloper or XJInvestigator then the nets can be viewed in Explorer as well.
XJAnalyser
The final way of diagnosing a fault is to use XJAnalyser.
To find out more about the behaviour of a fault, you can try using XJAnalyser to trace the signals around the board.
For instance, set one of the open/shorted pins to toggle. Then open the  Pin Watch window, right-click on it and select Monitor Changing Pins to add all toggling pins to the watch. Note which other pins toggle at the same time as the driven pin.
You may also need to use other equipment such as oscilloscopes or voltmeters in conjunction with XJAnalyser to confirm whether the circuit is behaving as expected.
XJTAG v4.3.0