Waveform View
The Waveform View gives an alternative graphical representation of the pins in the JTAG chain. Pins or busses can be dragged from the Chain View, Pin Watch or Pin List windows, and the Waveform View will display a trace showing the value of that pin or bus over time. Triggering functionality is also supported by the Waveform View.
Read and Write values
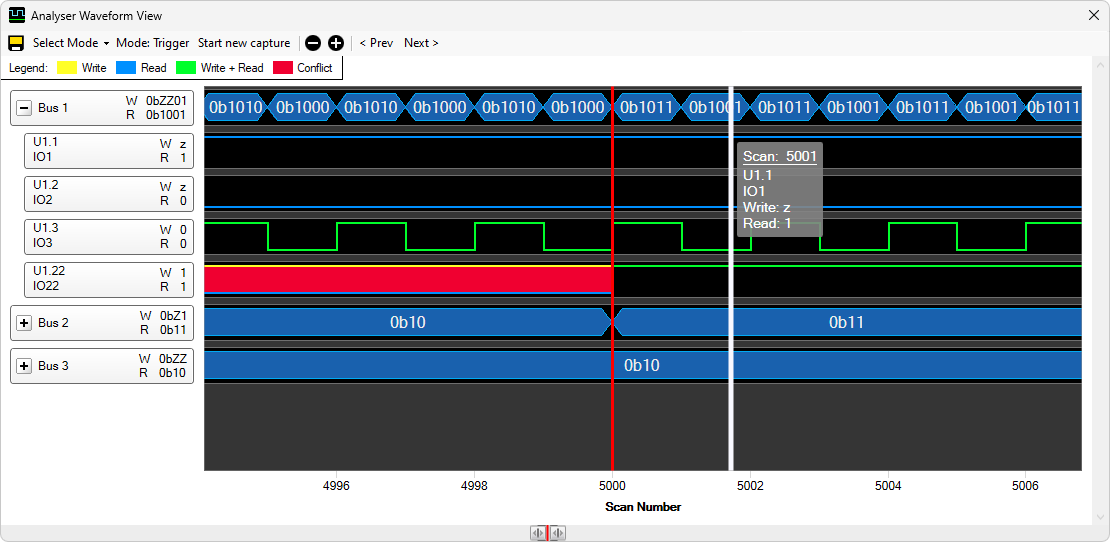
Through JTAG, it is possible to record both a read value and a write value for some pins. Different colours are used to highlight the difference between pins that are passively reading (blue) and those that are actively writing (green). It is expected that the two values match, and if they do not the area where they conflict is highlighted in red.
Both the write values and read values are displayed on the column headers on the left hand side of the screen, in the W and R rows respectively. 1 and 0 represent reading back high and low respectively. A 'z' shown as the write (W) value indicates that that pin is tristate i.e. it has a control cell and that control cell is disabled. A '-' in either row means that it was not possible to record that value on that scan, either because that pin does not have an input or output cell, or that device is in a mode such as BYPASS where that cell is not read.
Live mode
With the Waveform View in live mode, data is captured and displayed from the JTAG chain in real time. To start a capture in live mode, drag some pins or busses into the Waveform View, then select Live from the Select Mode dropdown list. This will start a new capture, which will scroll automatically as new data is captured. To stop the live capture, click the Stop current capture button. The Waveform View will then stop scrolling, and the captured data can be examined. The data can also be saved by clicking on the Save button.
While the Waveform view is in live mode, it is also possible to control the pins by right clicking on them, which brings up the Set Pin Value Menu. Extra pins or busses can be added to the Waveform View while live mode is running, although it is not possible to change the pins in a bus while the Waveform View is displaying data for that bus.
Trigger mode
Triggering is also supported by the Waveform View. In triggering mode, instead of displaying all the data received, a buffer of scans is kept until a set of conditions are all met, when the data around that trigger point is displayed. This means that if you have an intermittent problem on a board, the Waveform View can be left running until that problem occurs, and then the context around it can be displayed
To set up the Waveform View in triggering mode, first drag in the items that you are interested in watching. You can drag pins to the Waveform View from the Pin List, Pin Watch or Chain View panes. Busses in the Pin Watch can also be dragged into the Waveform View.
When the pins and busses are set up in the Waveform View, select Trigger from the Select Mode dropdown list. This will display a dialog used to set the trigger values, the buffer size, and the position in the buffer that the trigger should be displayed.
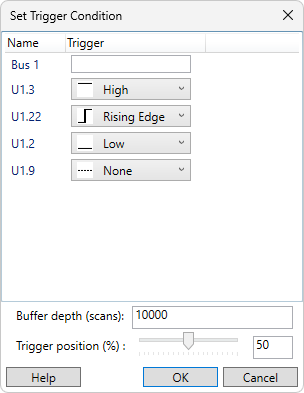
Each pin can have a trigger condition set of High, Low, Rising edge or Falling Edge. The High and Low conditions are met when the pin reads back that value, and the Rising Edge and Falling Edge conditions are met when the value changes from low to high or high to low. If conditions are set on multiple pins, the trigger will only fire if all the conditions are true in the same scan.
Each bus may be set to trigger on the combined read value of the pins in that bus. This value must be entered as a hexadecimal value. When the combined read value of the bus equals this value, the condition is met. This condition gets applied along with any additional conditions added to the pins in the bus, meaning the trigger will only fire if all the conditions are true in the same scan.
The buffer depth sets how many scans in total the Waveform View will keep. A larger number will give more information around the trigger, but a smaller number will result in higher performance, particularly on machines with limited RAM.
The Trigger position control sets where in the buffer the trigger should occur. If the trigger position is set to 0%, then the full buffer will be recorded after the trigger is hit, and no data before the trigger is hit will be kept. If the trigger position is set to 100%, then the full buffer will be kept before the trigger is hit (if it is full when the trigger is hit), and no information is recorded after the trigger is hit.
If the trigger is hit before the buffer is full, then any data to record after the trigger is hit will still be recorded, but the buffer will not necessarily be filled with data from before the trigger. For example, if the buffer depth is set to 1000 scans, the trigger position set to 50% and the trigger is met on scan 100, 100 scans will be displayed before the trigger is met and 500 scans afterwards.
Tooltip menu
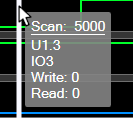
Hover the mouse pointer over a waveform to display further information in a tooltip:
- Scan number
- Pin or bus name
- Write value
- Read value
Review mode
It is possible to save a set of recorded data and review it later. After recording data in either live or trigger modes, the save button is enabled and it is possible to save the data out to a file. This can be reloaded later by selecting select Review from the Select Mode dropdown list. This will prompt you to select the recording you want to review, then display it.
Other functionality
Navigating around the Waveform View
- Scrolling: The traces in the Waveform View can be scrolled left and right, either by clicking and dragging the trace area, or by clicking and dragging the overview bar at the bottom of the control.
- Zooming: The Waveform View can be zoomed in or out either by holding CTRL and scrolling the middle mouse wheel, or by dragging the edges of the highlighted area in the overview bar at the bottom of the control.
- Skip to transition: If a row is selected (by clicking on it), then clicking the < Prev and Next> buttons will skip backwards or forwards so that the next transition in the selected row is in the centre of the Waveform View.
It is also possible to add bookmarks to the Waveform View, to mark an area of the recording that is of particular interest. Double-clicking on the Waveform View will add a bookmark both to the trace area and to the overview bar at the bottom of the control. If you then scroll away from this area, it is easy to navigate back to it using the overview bar. Right-clicking on an existing bookmark will remove it.
XJTAG v4.3.0