Connection Test Output Viewer
When the Connection Test Settings in the XJRunner Setup screen are configured appropriately, the Connection Test output may include a link to Show full output data. Clicking on this link will launch the Full Connection Test Output window.
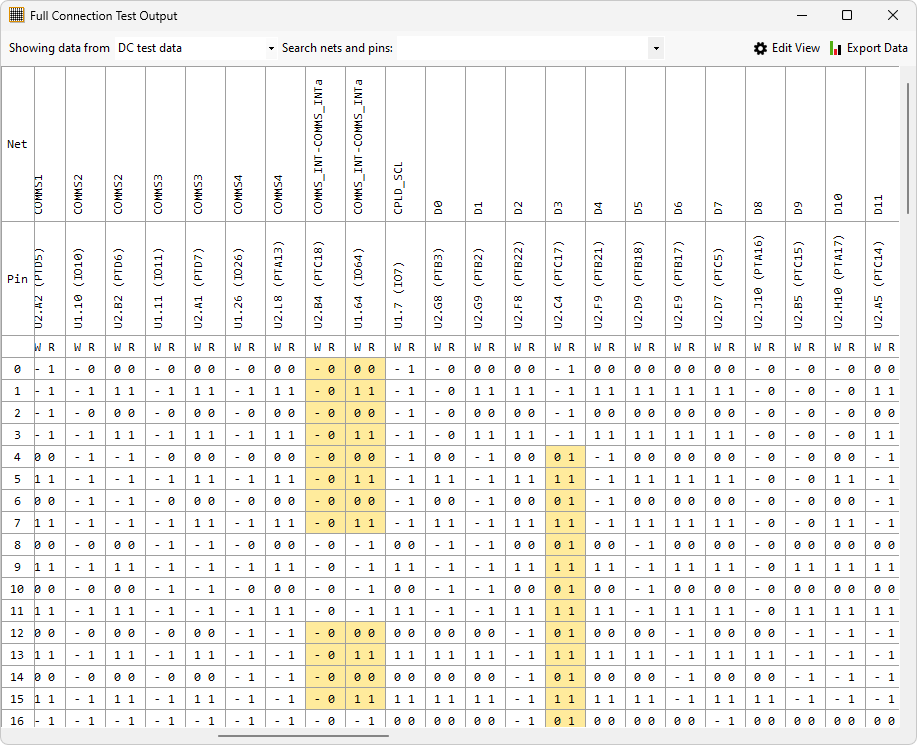
The Full Connection Test Output window shows all the values recorded by the Connection Test during the test run. The data is shown in a grid, with pins and their nets listed across the top of the grid and the test number listed down the side. Each grid cell contains a Write and a Read value for the pin.
The Connection Test records its data in up to 4 main sections - the default one shown above is the "DC test" data (1149.1 general testing) but there may also, depending on the circuit and the Connection Test configuration be "AC test" data (1149.6 testing) and/or two phases of logic testing. You can select the data to be shown using the drop-down menu at the top of the window.
The Full Connection Test Output window does not detail the fault diagnosis as the test output does, but it highlights (in yellow, as shown) any values in the data where a pin did not read the value that was expected.
Note that the Full Connection Test Output dialog shows more tests than the normal XJTAG output from the Connection Test. This allows the user to see the extra analysis that is done after the main testing (but not normally shown) in order to confirm or rule out possible short-circuit errors. The number of tests shown in the Full Connection Test Output is therefore variable - it may change between test runs or between PCBs depending on the behaviour of the circuit and any changing nets on the circuit during the testing.
Test Output Context Menu
There are several options on the context menu that appears when right-clicking on a grid cell:
- Freeze/unfreeze this net: A net which is frozen is always displayed in a fixed position on the left side of the data, even as you scroll through the other (unfrozen) nets using the scrollbar.
- Hide this net: Hidden nets are simply not shown in the main dialog box, reducing clutter or perhaps hiding nets which you have ruled out of involvement with a particular issue.
- Move this net: This option allows you to rearrange the columns of the grid in case their default ordering is not convenient for your purposes.
Edit View Dialog
Clicking on the Edit View button opens the Edit View dialog. This dialog has two tabs which allow the user to adjust and filter the Connection Test data in order to make it easier to understand the issues that it may be showing.
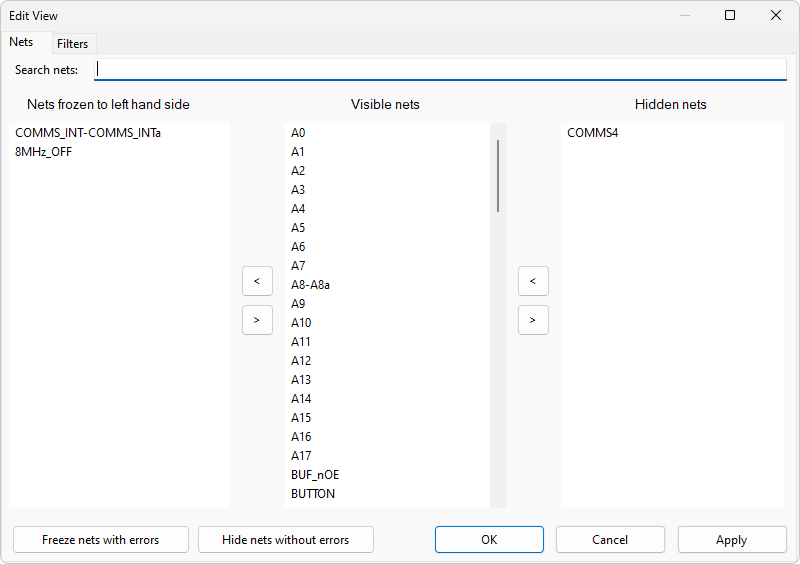
The Nets tab allows nets to be frozen or hidden as described in the context menu section above.
- Nets can be moved between the frozen, visible and hidden columns using the arrow buttons.
- The Freeze nets with errors button can be used to freeze all nets with errors.
- The Hide nets without errors button will hide all nets without errors.
Note that nets that are displayed in this dialog can be filtered by using the Search textbox.
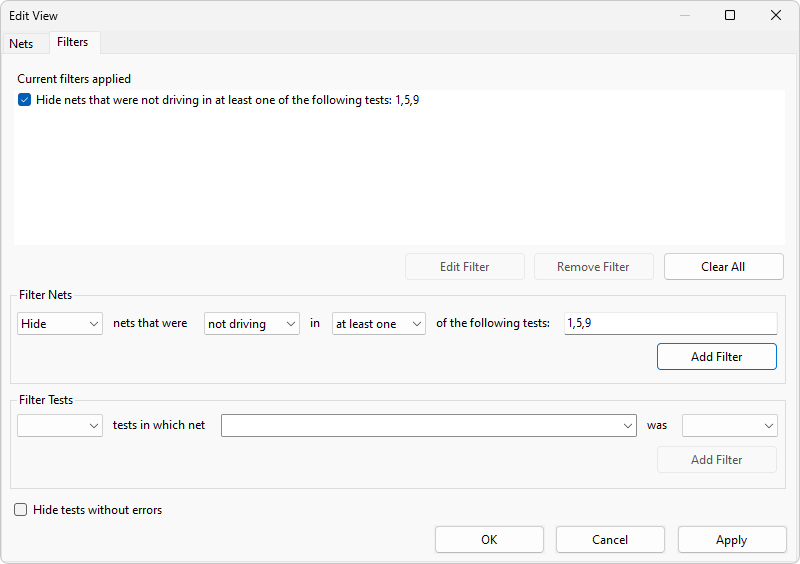
The Filters tab allows filters to be constructed for a variety of scenarios in order to hide nets (columns) or tests (rows) in the main dialog box. This allows the user to (for example) focus on the tests where errors were detected, or to search for which nets which were driving at the same time an error was detected.
Filters can be applied by filling in the fields and dropdown menus of either the Filter Nets panel or the Filter Tests panel as shown below, and then clicking the relevant Add Filter button to filter out columns or rows respectively.
Note that the current data set being shown cannot be changed while the Edit View dialog is open.
Exporting data
Clicking the Export button allows the data from the Connection Test to be exported as a comma-separated (*.csv) file for view in a spreadsheet program or for later comparison with other data. There is a choice of whether to export all of the data for this connection test (for the currently selected connection test mode), or whether to only export data for nets which are currently visible according to the settings in the Edit View dialog.
The Full Connection Test output is also saved if you have formatted log file generation enabled in the XJRunner Settings, in which case the output can be viewed (and exported) from the Log File Viewer.
XJTAG v4.3.0