Test Coverage in the Layout Viewer
Test coverage can be visualised by displaying the coverage in the Layout Viewer.
The Test Coverage Data in Layout Viewer dropdown menu on the Summary Statistics tab of the Test Coverage screen provides the following options which correspond to columns in the Summary Statistics table:
- Tested Pins
- Power Pins
- Untested Pins
- Jtag Pins
- Tested for short circuit errors
- Tested for open circuit errors
- Tested for stuck high errors
- Tested for stuck low errors
- Tested by functional tests
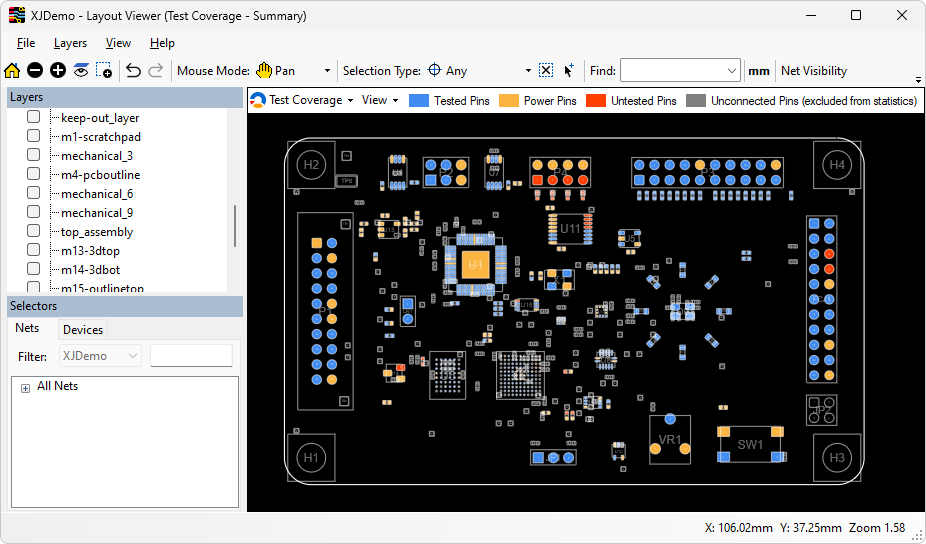
In addition, a Summary option combines tested, untested and unconnected pins in a single view.
The Test Coverage Data in Layout Viewer dropdown menu is also available within the Layout Viewer when it is displaying test coverage data. An additional View dropdown menu allows the user to easily switch between showing the coverage on the top, bottom or top and bottom layers.
XJTAG v4.3.0